A program supporting startups with Cloud and AI Factory services at HITECHCLOUD

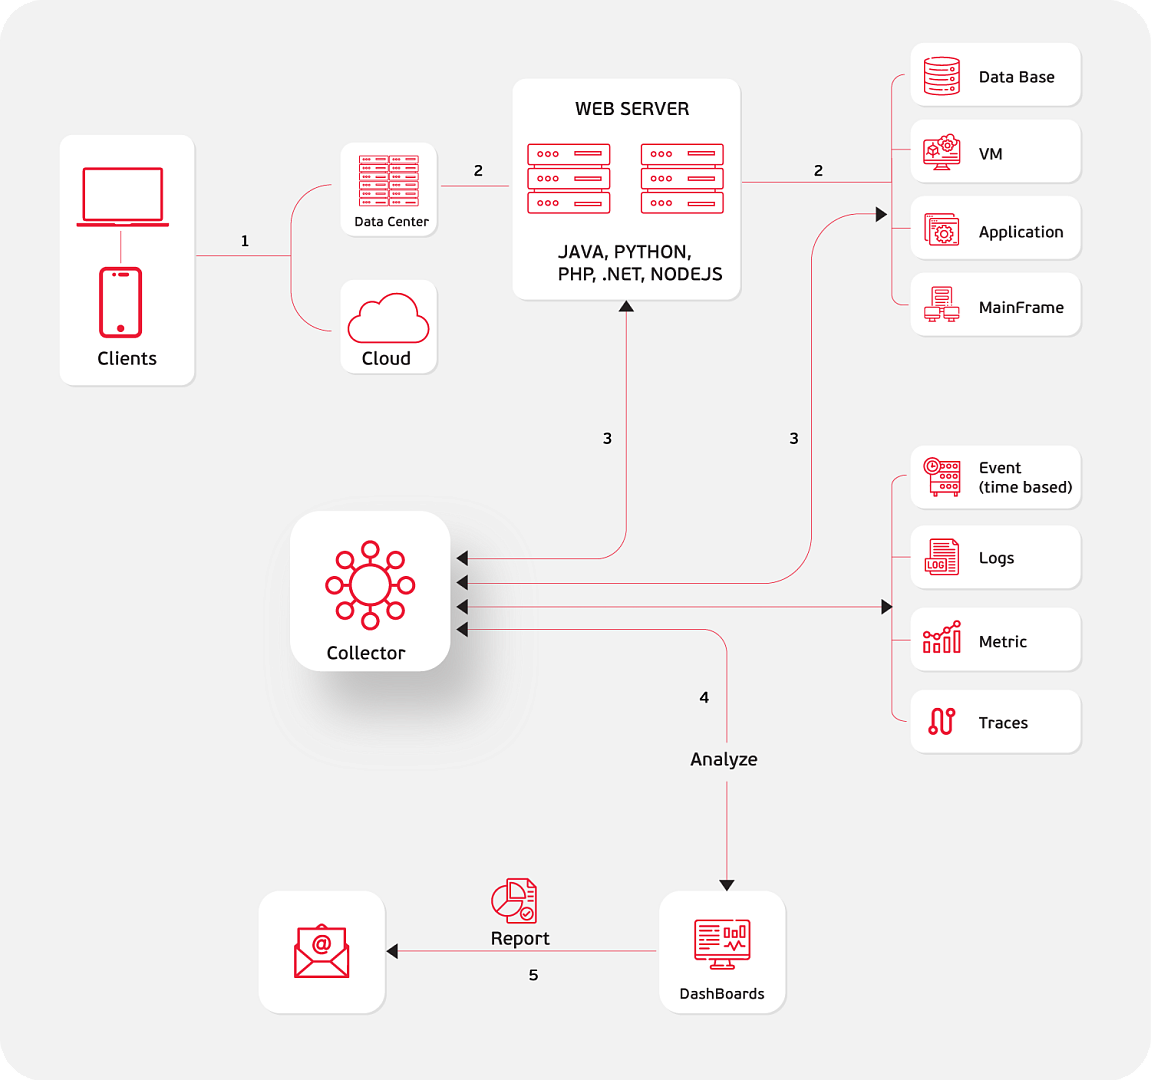
vAPM collects, analyzes and processes telemetry data to build dashboards, real-time alerts and end-to-end tracing for modern web, mobile and digital services.
vAPM lets a business observe application performance in real time from telemetry data, and build dashboards, alerts and incident traces on a single unified view.
The solution suits web and mobile applications, APIs, internal services and cloud-native systems running in increasingly complex environments.
Rather than passive monitoring, vAPM creates an active observability layer so that operations teams can identify root causes, reduce MTTD and MTTR, and improve the end-user experience.
vAPM combines technical and experience data into a single observability layer for development and operations teams.
Consolidates system data onto a single platform, supports collection from open source environments, and combines the full set of components needed for 24/7 operations.

Distributed tracing, log-to-trace correlation, and code-level drill-down reveal bottlenecks before they affect users.

Monitoring SLAs and business KPIs and surfacing application errors in real time lets engineering teams intervene sooner.

Browser monitor, synthetic monitor and mobile monitor give a direct view of user behavior and service quality.
vAPM moves from fragmented observation to proactive diagnosis, centralizing data and answering deeper questions about each incident.
The solution fits modern application architectures: web services, mobile app back ends, containers and cloud-native systems that require close control.
The vAPM agent typically uses only a small share of system resources and suits a wide range of application environments.
Collects metrics, logs, events and traces to support analysis in context.
Connect easily to your existing open-source stack while extending to APIs, dashboards and workflows.
Combine browser, synthetic and mobile monitors to see the full user journey end to end.
From system reliability to user experience, vAPM delivers clear benefits for organizations running digital applications at scale.

Operations teams gain confidence when every application state is tracked and alerted on centrally.

Identifying the true root cause saves engineering time and lets the team focus on improving features.

Manage applications, users, alerts, and resources from a single unified interface.

Lower cost in people, tooling and time than building your own monitoring team from scratch.
24/7 application monitoring with a clear view of service maps and critical transaction chains.
Drill down to code level to shorten MTTD and MTTR and reduce the impact on end users.
Browser, synthetic and mobile monitoring give clear data for a better digital experience.
vAPM is built for organizations that need end-to-end visibility into request handling, incidents and user experience across multiple infrastructure layers.
Suited to systems that generate core revenue or have strict requirements for availability, performance and continuous monitoring.
Supports modern application environments built on containers, Kubernetes and increasingly complex distributed architectures.
For software, outsourcing, gaming and digital application companies that need end-to-end monitoring.
Monitor the performance of web services and mobile app services to maintain load speed, stability and user experience.
vAPM brings together modern observability technology, clear operating procedures and flexible integration so your business can focus on growth.
If needed, the team can assess your current application architecture and propose a suitable monitoring scope, alerting setup and integration model.
vAPM is an Application Performance Monitoring solution that helps businesses collect, analyze and process telemetry for end-to-end application performance monitoring.
vAPM works with metrics, logs, events and traces, and combines dashboards, real-time alerting and a service map for system observability.
The agent is designed for a small resource footprint, which varies with the application, environment and specific deployment configuration.
Yes. The solution supports common languages including Go, Java, .NET, Node.js, PHP, Python and Ruby.
vAPM suits websites, mobile applications, API systems, cloud-native services, and any environment that needs proactive monitoring.
It usually requires a review of the application architecture, monitoring scope, alerting requirements, permissions, and existing integrations.
Contact us for advice on the vAPM model that fits your current systems, your monitoring scope and your user-experience optimization goals.






















































































































Start deploying quickly with HiTechCloud
Announcements, in-depth analysis and events









































Start building with HiTechCloud and shape a complete AI and cloud strategy
Log in to explore an ecosystem of more than 30 products and the tools that come with them
Get started
Talk to our sales team and find the AI and cloud solution that fits your business
Contact salesCông ty Cổ Phần Giải Pháp Công Nghệ và Phần Mềm Phổ Tuệ
Address: 128 Đường Bình Mỹ, Bình Mỹ Commune, Ho Chi Minh City, Vietnam
Tax code: 0318222903, first issued by the Ho Chi Minh City Department of Planning and Investment on 20/12/2023, amended for the second time on 15/10/2024
Responsible for content: Nguyễn Thanh An
Hotline: Phone: 0865.920.041
Email: Email: info@photuesoftware.com
Email Abuse: abuse@photuesoftware.com
Certificate: Telecommunications service registration certificate No. 18/GCN-SKHCN, issued by the Ho Chi Minh City Department of Science and Technology on 10/03/2026.
Căn hộ OT03, Tòa nhà The Landmark 81, 720A Đ. Điện Biên Phủ, Vinhomes Tân Cảng, Phường Thạnh Mỹ Tây, Tp. Hồ Chí Minh
5F, Ginza Sky Building, 3-13-4 Ginza, Chuo-ku, Tokyo, Japan
Email: contact.jp@hitechcloud.asia
6F, Yanghwa Tower, 5 Teheran-ro 20-gil, Yeoksam-dong, Gangnam District, Seoul, South Korea
5F, Sugimoto Building, 1-4-7 Tokui-cho, Chuo-ku, Osaka, Japan
Email: contact.jp@hitechcloud.asia
7F, ONE FUKUOKA BLDG, 1-11-1 Tenjin, Chuo-ku, Fukuoka, Japan
Email: contact.jp@hitechcloud.asia
81-83 Campbell Street Surry Hills, NSW 2010, Australia
Email: sydney@hitechcloud.asia
150 E Brokaw Rd, San Jose, CA 95112, United States
Email: contact.us@hitechcloud.asia
36 Robinson Road, #20-01, City House, Singapore 068877
Email: contact.sgp@hitechcloud.asia
Mezzanine Floor, Jumeirah Living Marina Gate 3, Dubai Marina, Dubai, PO Box 121828